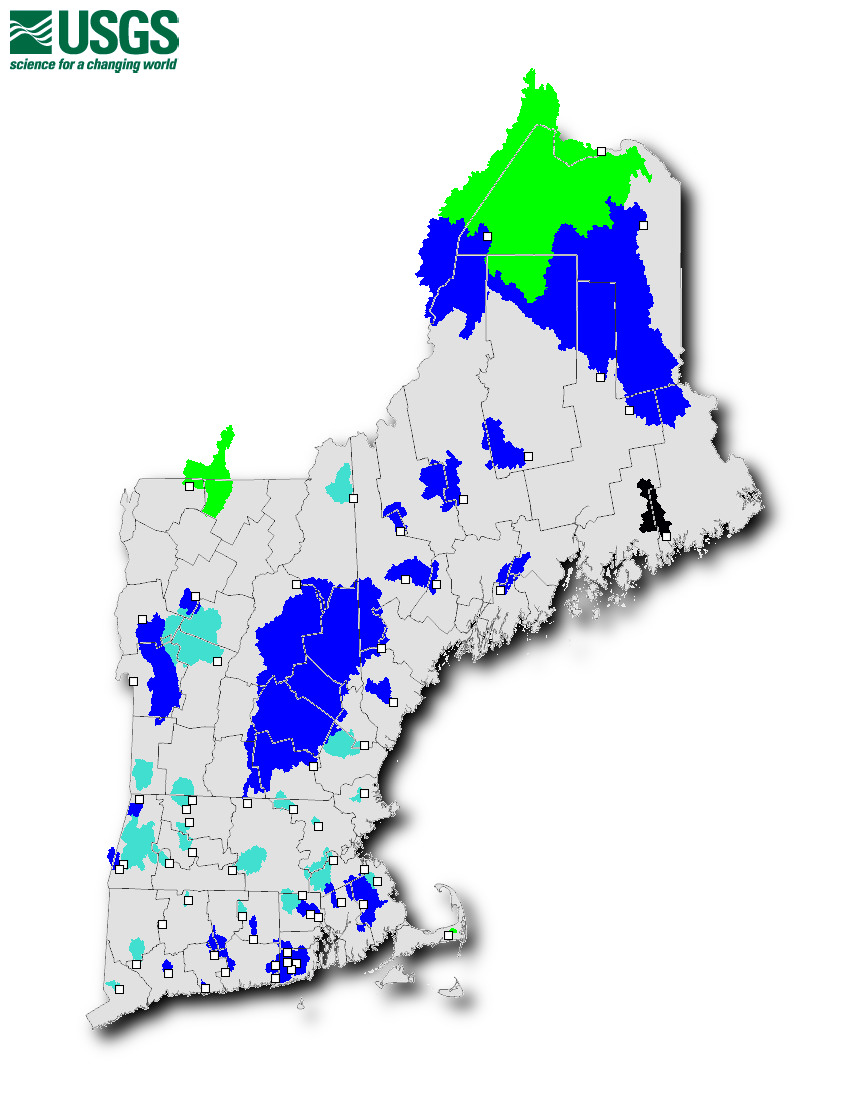
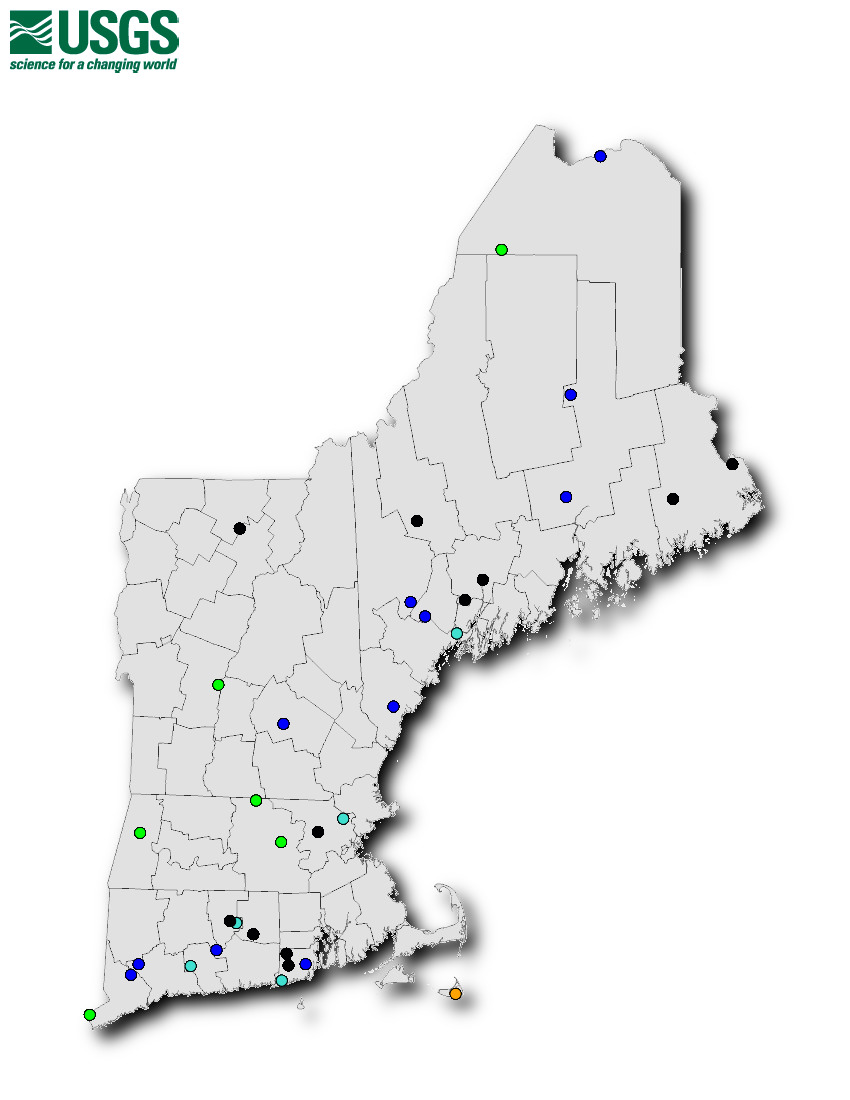
These reports map and tabulate the monthly hydrologic conditions for selected sites for the most recent available month. Historic reports for previous months are available below the regional maps.
The data and methods used to compute the monthly hydrologic conditions are described in the explanation at the bottom of this page.
To view state-specific maps, with site-specific conditions and data links, select the state from the following list or by clicking within its border in the regional map below.
These reports map and tabulate the monthly hydrologic conditions for selected sites for the historic months (if available). Current reports for the most recent available month are available at the top of the page.
Reports for all months earlier than July 2018 are archived from other websites and previous versions and may have different formats. Reports for months not shown in the lists were not created and are not available.
Surface water sites used in these reports are selected to represent major watersheds, to have a period of record of at least 50 years, and to be minimally impacted by manmade systems. Groundwater sites are selected to represent major aquifers, to have a period of record of at least 10 years, and to be minimally impacted by manmade systems. Groundwater data may be either continuous or discrete. Footnotes in the groundwater statistics table indicate which type of data were used in computation.
All data available for each site from the National Water Information System (NWIS) -- including provisional or unapproved data -- are used in the computation of statistics. The current month's statistic (i.e., monthly mean flow or monthly median groundwater level) is computed from the set of all daily mean values in the month (for sites with continuous data) or from the set of all field readings in the month (for sites with discrete data). For the month of March 2019 or earlier, for sites with continuous data, a daily mean value had to exist for every day of the month; partially complete months were not computed. Beginning with the month of April 2019, partially complete months are computed for all sites with daily mean values existing for at least 90% of the days in the month. For sites with discrete data, there is no completeness requirement. For comparability between months, discrete data are usually collected within the window of the last 3 days of each month.
The same data and criteria are used in the computation of historical months. For instance, for a surface water site with continuous data being computed in September, daily mean flow values for all previous Septembers in the period of record are obtained from NWIS, and a monthly mean flow value is computed for each of those historical Septembers with complete records for the month. Those historical monthly mean flows are then ordered by magnitude, and percentile flows (0th, 10th, 25th, 75th, 90th, and 100th percentiles) are determined from the ordered data set. The current month's statistical value (in this example, September of this year) is then compared to the percentile values to determine into which percentile range it falls. Percentile ranges and the names associated with them (e.g., "low", "normal", etc.) are explained in each state's report.
Additional information and statistics for each surface water or groundwater site may be found on that site's NWIS webpage, linked in the maps and tables of the state reports, or at https://waterdata.usgs.gov/nwis.
Accessibility
FOIA
Privacy
Policies and Notices
U.S. Department of the Interior |
U.S. Geological Survey
URL: http://newengland.water.usgs.gov/monthly_conditions/index.html
Page Contact Information:
Page Last Modified: Tuesday, 16-Apr-2024 14:25:59 EDT