
August 2021
USGS New England Water Science Center, Massachusetts-Rhode Island Office
PROVISIONAL DATA: All data presented in this report are provisional and subject to revision.
Return to home page

CURRENT WATER RESOURCES CONDITIONS IN MASSACHUSETTS |
|---|
|
August 2021USGS New England Water Science Center, Massachusetts-Rhode Island OfficePROVISIONAL DATA: All data presented in this report are provisional and subject to revision.Return to home page | |
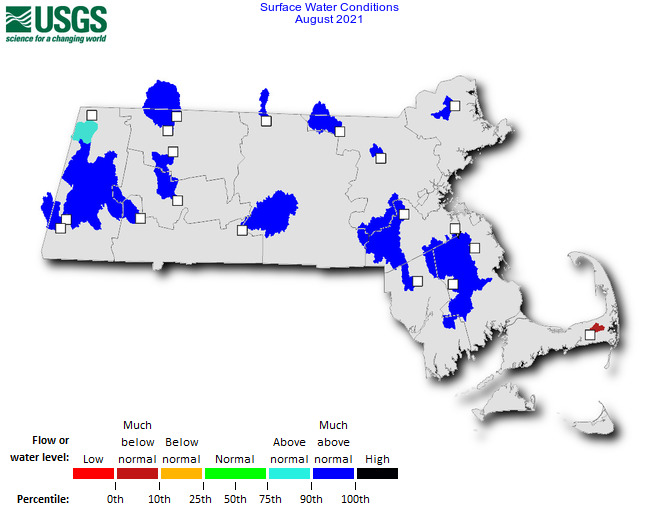  |
| SURFACE WATER | |||||||
|---|---|---|---|---|---|---|---|
| Station Number | Station Name |
Drainage Area (mi2) | Years Of Record | Normal Range (cfs) | Monthly Mean (cfs) | Monthly Mean (in) | Percentile Class |
| 01096000 | Squannacook River near West Groton, MA | 65.9 | 71 | 14.7 - 37.2 | 93.4 | 1.63 | Much above normal |
| 01097300 | Nashoba Brook near Acton, MA | 12.8 | 58 | 1.17 - 6.66 | 13.6 | 1.22 | Much above normal |
| 01101000 | Parker River at Byfield, MA | 21.3 | 75 | 1.03 - 8.33 | 32.2 | 1.74 | Much above normal |
| 01103500 | Charles River at Dover, MA | 183 | 83 | 39.8 - 129 | 268 | 1.69 | Much above normal |
| 01105600 | Old Swamp River near South Weymouth, MA | 4.5 | 55 | 0.95 - 4.28 | 13.5 | 3.46 | High |
| 01105730 | Indian Head River at Hanover, MA | 30.3 | 55 | 7.62 - 30.3 | 87.7 | 3.34 | Much above normal |
| 01105880 | Herring River at North Harwich, MA | 9.4 | 55 | 3.92 - 8.64 | 1.95 | 0.24 | Much below normal |
| 01108000 | Taunton River near Bridgewater, MA | 261 | 91 | 77.1 - 204 | 647 | 2.86 | Much above normal |
| 01109000 | Wading River near Norton, MA | 43.3 | 96 | 6.91 - 24 | 59.6 | 1.59 | Much above normal |
| 01162500 | Priest Brook near Winchendon, MA | 19.4 | 105 | 2.47 - 11.9 | 44.4 | 2.64 | Much above normal |
| 01169000 | North River at Shattuckville, MA | 89 | 81 | 23.2 - 72.8 | 176 | 2.28 | Much above normal |
| 01169900 | South River near Conway, MA | 24.1 | 55 | 7.92 - 28.9 | 57.2 | 2.74 | Much above normal |
| 01170100 | Green River near Conway, MA | 41.4 | 53 | 12.3 - 39.7 | 84.3 | 2.35 | Much above normal |
| 01171500 | Mill River at Northampton, MA | 52.6 | 82 | 14.8 - 43.8 | 113 | 2.48 | Much above normal |
| 01176000 | Quaboag River at West Brimfield, MA | 150 | 109 | 40.8 - 109 | 206 | 1.58 | Much above normal |
| 01181000 | West Branch Westfield River at Huntington, MA | 94 | 85 | 20.4 - 70.5 | 288 | 3.53 | Much above normal |
| 01197500 | Housatonic River near Great Barrington, MA | 282 | 108 | 128 - 284 | 713 | 2.91 | Much above normal |
| 01198000 | Green River near Great Barrington, MA | 51 | 69 | 7.93 - 31.6 | 124 | 2.80 | Much above normal |
| 01333000 | Green River at Williamstown, MA | 42.6 | 71 | 12 - 39.1 | 93.7 | 2.54 | Above normal |
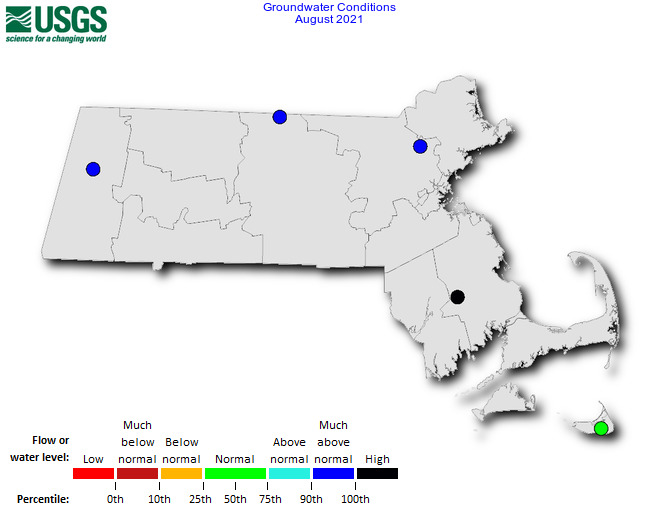
| GROUNDWATER | ||||||
|---|---|---|---|---|---|---|
| Station Number | Station Name |
Years Of Record | Normal Range (ft) | Monthly Median (ft) | Departure From Monthly Median (ft) | Percentile Class |
| 411555070021901 | NBW 228 (Nantucket, MA) | 421 | 24.00 - 12.70 | 12.75 | -10.55 | Normal |
| 415228070554601 | LKW 14 (Lakeville, MA) | 561 | 17.80 - 15.80 | 7.50 | -9.10 | High |
| 424520070562401 | NIW 27 (Newbury, MA) | 561 | 10.00 - 8.39 | 5.74 | -3.56 | Much above normal |
| 422745073112001 | PTW 51 (Pittsfield, MA) | 581 | 20.00 - 16.50 | 14.26 | -3.94 | Much above normal |
| 423401071093801 | XMW 78 (Wilmington, MA) | 691 | 9.50 - 8.44 | 7.18 | -1.75 | Much above normal |
| 424204072015201 | XNW 13 (Winchendon, MA) | 771 | 10.80 - 7.56 | 5.25 | -4.58 | Much above normal |
| 1 Daily Value Records and Field Readings 2 Daily Value Records Only | ||||||
| Flow or Water Level | Percentile Range | Explanation |
|---|---|---|
| Low | 0th | The monthly mean streamflow or median water level during this month is the lowest ever recorded during the period of record for this site. |
| Much below normal | 0th to 10th | The monthly mean streamflow or median water level during this month is less than the 10th percentile when compared to all of the months during the period of record for this site. |
| Below normal | 10th to 25th | The monthly mean streamflow or median water level during this month is between the 10th and 25th percentiles when compared to all of the months during the period of record for this site. |
| Normal | 25th to 75th | The monthly mean streamflow or median water level during this month is between the 25th and 75th percentiles when compared to all of the months during the period of record for this site. |
| Above normal | 75th to 90th | The monthly mean streamflow or median water level during this month is between the 75th and 90th percentiles when compared to all of the months during the period of record for this site. |
| Much above normal | 90th to 100th | The monthly mean streamflow or median water level during this month is greater than the 90th percentile when compared to all of the months during the period of record for this site. |
| High | 100th | The monthly mean streamflow or median water level during this month is the highest ever recorded during the period of record for this site. |