
August 2020
USGS New England Water Science Center, Maine Office, in cooperation with Maine Emergency Management Agency
PROVISIONAL DATA: All data presented in this report are provisional and subject to revision.
Return to home page

CURRENT WATER RESOURCES CONDITIONS IN MAINE |
|---|
|
August 2020USGS New England Water Science Center, Maine Office, in cooperation with Maine Emergency Management AgencyPROVISIONAL DATA: All data presented in this report are provisional and subject to revision.Return to home page | |
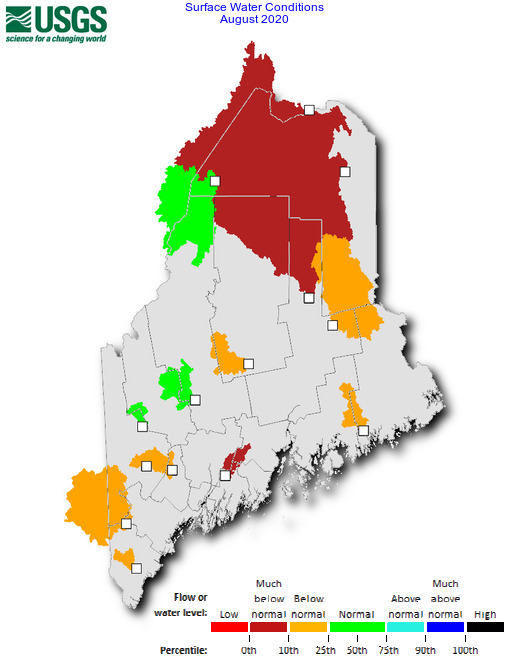  |
| SURFACE WATER | |||||||
|---|---|---|---|---|---|---|---|
| Station Number | Station Name |
Drainage Area (mi2) | Years Of Record | Normal Range (cfs) | Monthly Mean (cfs) | Monthly Mean (in) | Percentile Class |
| 01010000 | St. John River at Ninemile Bridge, ME | 1341 | 69 | 415 - 2020 | 438 | 0.38 | Normal |
| 01014000 | St. John River below Fish River at Fort Kent, ME | 5929 | 93 | 2250 - 5920 | 1250 | 0.24 | Much below normal |
| 01017000 | Aroostook River at Washburn, ME | 1654 | 90 | 431 - 1240 | 176 | 0.12 | Much below normal |
| 01022500 | Narraguagus River at Cherryfield, ME | 227 | 72 | 63.2 - 182 | 52.8 | 0.27 | Below normal |
| 01029500 | East Branch Penobscot River at Grindstone, ME | 837 | 117 | 552 - 1040 | 410 | 0.56 | Much below normal |
| 01030500 | Mattawamkeag River near Mattawamkeag, ME | 1418 | 85 | 262 - 966 | 164 | 0.13 | Below normal |
| 01031500 | Piscataquis River near Dover-Foxcroft, ME | 298 | 117 | 61 - 200 | 45.7 | 0.18 | Below normal |
| 01038000 | Sheepscot River at North Whitefield, ME | 145 | 81 | 24.3 - 57.8 | 14.9 | 0.12 | Much below normal |
| 01047000 | Carrabassett River near North Anson, ME | 353 | 117 | 102 - 316 | 119 | 0.39 | Normal |
| 01055000 | Swift River near Roxbury, ME | 96.9 | 91 | 25.7 - 91.8 | 29.4 | 0.35 | Normal |
| 01055500 | Nezinscot River at Turner Center, ME | 169 | 79 | 33.5 - 110 | 25.5 | 0.17 | Below normal |
| 01057000 | Little Androscoggin River near South Paris, ME | 73.5 | 106 | 12.3 - 54.4 | 7.96 | 0.12 | Below normal |
| 01066000 | Saco River at Cornish, ME | 1293 | 104 | 666 - 1270 | 656 | 0.58 | Below normal |
| 01069500 | Mousam River near West Kennebunk, ME | 99 | 80 | 38.6 - 75.6 | 30.8 | 0.36 | Below normal |
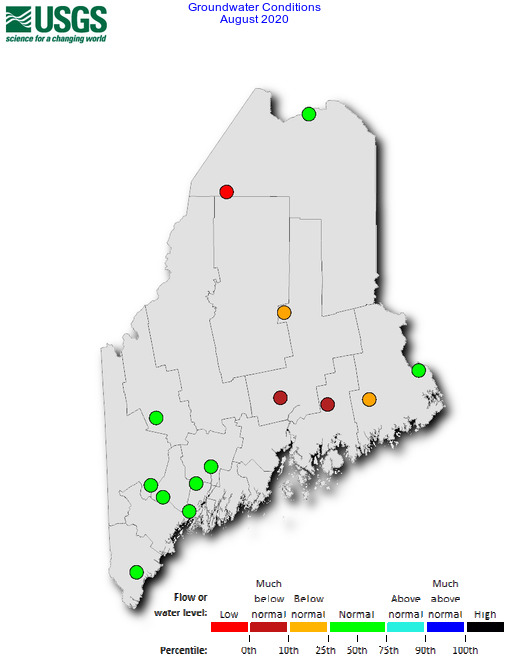
| GROUNDWATER | ||||||
|---|---|---|---|---|---|---|
| Station Number | Station Name |
Years Of Record | Normal Range (ft) | Monthly Median (ft) | Departure From Monthly Median (ft) | Percentile Class |
| 432310070393301 | YW 807 (Sanford, ME) | 302 | 18.90 - 17.20 | 18.25 | -0.15 | Normal |
| 435453070013601 | CW 26 (Brunswick, ME) | 412 | 31.20 - 26.80 | 28.31 | -1.29 | Normal |
| 440213070203201 | ANW 1135 (Rang Pond, ME) | 192 | 10.60 - 9.87 | 10.45 | 0.25 | Normal |
| 440823070291501 | OW 1214 (Oxford, ME) | 392 | 9.27 - 8.08 | 9.09 | 0.35 | Normal |
| 440918069564001 | KW 766 (Litchfield, ME) | 422 | 48.30 - 44.40 | 46.76 | 0.36 | Normal |
| 441801069455501 | KW 887 (Augusta Arboretum, ME) | 152 | 15.10 - 11.80 | 14.79 | 0.59 | Normal |
| 444302070252401 | FW 916 (Weld/Mt. Blue, ME) | 182 | 26.60 - 24.50 | 26.34 | 0.74 | Normal |
| 444950068220602 | HW 1A (Amherst, ME) | 302 | 25.10 - 22.10 | 25.45 | 2.15 | Much below normal |
| 445227067520101 | WW 797 Township T24MD BPP (Hadley Lakes, ME) | 342 | 5.88 - 5.46 | 6.14 | 0.44 | Below normal |
| 445319068560101 | PEW 456 (Kenduskeag, ME) | 422 | 24.30 - 23.20 | 25.12 | 1.32 | Much below normal |
| 450713067162801 | WW 796 (Calais, ME) | 202 | 3.68 - 2.22 | 2.81 | -0.16 | Normal |
| 453629068531801 | PEW 594 (Millinocket, ME) | 262 | 10.50 - 9.44 | 10.66 | 0.71 | Below normal |
| 463642069344601 | ARW 891 (Clayton Lake, ME) | 412 | 16.30 - 15.30 | 16.74 | 0.94 | Low |
| 471457068353001 | ARW 890 (Fort Kent, ME) | 422 | 11.10 - 8.46 | 10.42 | 0.74 | Normal |
| 1 Daily Value Records and Field Readings 2 Daily Value Records Only | ||||||
| Flow or Water Level | Percentile Range | Explanation |
|---|---|---|
| Low | 0th | The monthly mean streamflow or median water level during this month is the lowest ever recorded during the period of record for this site. |
| Much below normal | 0th to 10th | The monthly mean streamflow or median water level during this month is less than the 10th percentile when compared to all of the months during the period of record for this site. |
| Below normal | 10th to 25th | The monthly mean streamflow or median water level during this month is between the 10th and 25th percentiles when compared to all of the months during the period of record for this site. |
| Normal | 25th to 75th | The monthly mean streamflow or median water level during this month is between the 25th and 75th percentiles when compared to all of the months during the period of record for this site. |
| Above normal | 75th to 90th | The monthly mean streamflow or median water level during this month is between the 75th and 90th percentiles when compared to all of the months during the period of record for this site. |
| Much above normal | 90th to 100th | The monthly mean streamflow or median water level during this month is greater than the 90th percentile when compared to all of the months during the period of record for this site. |
| High | 100th | The monthly mean streamflow or median water level during this month is the highest ever recorded during the period of record for this site. |