
February 2020
USGS New England Water Science Center, New Hampshire-Vermont Office
PROVISIONAL DATA: All data presented in this report are provisional and subject to revision.
Return to home page

CURRENT WATER RESOURCES CONDITIONS IN VERMONT |
|---|
|
February 2020USGS New England Water Science Center, New Hampshire-Vermont OfficePROVISIONAL DATA: All data presented in this report are provisional and subject to revision.Return to home page | |
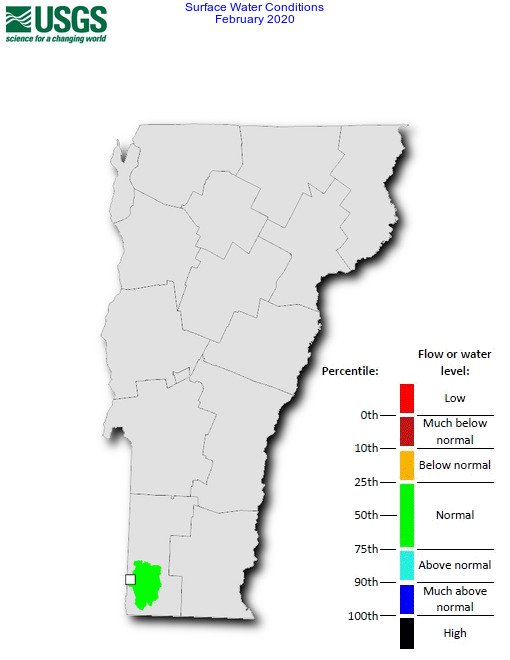  |
| SURFACE WATER | |||||||
|---|---|---|---|---|---|---|---|
| Station Number | Station Name |
Drainage Area (mi2) | Years Of Record | Normal Range (cfs) | Monthly Mean (cfs) | Monthly Mean (in) | Percentile Class |
| 01334000 | Walloomsac River near North Bennington, VT | 111 | 88 | 124 - 238 | 191 | 1.86 | Normal |
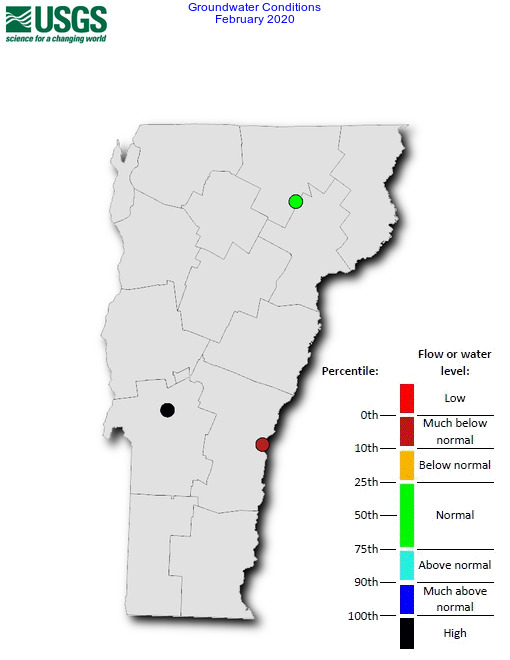
| GROUNDWATER | ||||||
|---|---|---|---|---|---|---|
| Station Number | Station Name |
Years Of Record | Normal Range (ft) | Monthly Median (ft) | Departure From Monthly Median (ft) | Percentile Class |
| 433240072242901 | HLW 54 (Hartland, VT) | 481 | 9.03 - 8.59 | 9.18 | 0.32 | Much below normal |
| 434217073010601 | PFW 8 (Pittsford, VT) | 581 | 37.60 - 36.80 | 34.80 | -2.50 | High |
| 443952072114001 | GLW 1 (Glover, VT) | 481 | 17.20 - 16.10 | 16.12 | -0.58 | Normal |
| 1 Daily Value Records and Field Readings 2 Daily Value Records Only | ||||||
| Flow or Water Level | Percentile Range | Explanation |
|---|---|---|
| Low | 0th | The monthly mean streamflow or median water level during this month is the lowest ever recorded during the period of record for this site. |
| Much below normal | 0th to 10th | The monthly mean streamflow or median water level during this month is less than the 10th percentile when compared to all of the months during the period of record for this site. |
| Below normal | 10th to 25th | The monthly mean streamflow or median water level during this month is between the 10th and 25th percentiles when compared to all of the months during the period of record for this site. |
| Normal | 25th to 75th | The monthly mean streamflow or median water level during this month is between the 25th and 75th percentiles when compared to all of the months during the period of record for this site. |
| Above normal | 75th to 90th | The monthly mean streamflow or median water level during this month is between the 75th and 90th percentiles when compared to all of the months during the period of record for this site. |
| Much above normal | 90th to 100th | The monthly mean streamflow or median water level during this month is greater than the 90th percentile when compared to all of the months during the period of record for this site. |
| High | 100th | The monthly mean streamflow or median water level during this month is the highest ever recorded during the period of record for this site. |